Originally published: 17 July 2026
Updated on: 21 July 2026
Two OneCity clients, CollegeMarker and WeCare24, agreed to let us publish real Google Search Console numbers instead of a vague testimonial. Over the past twelve months, CollegeMarker’s average search position improved from 24 to a sustained 7 to 8. WeCare24 grew monthly organic clicks nearly fivefold at its strongest point. Here is the verified data behind both, including the parts of the story that were not a straight line up.
Why We Are Publishing Raw Numbers Instead of Testimonials
Most SEO case studies in Bangalore read the same way: a vague percentage, no visible source, and a client name that may or may not have approved the quote attributed to them. That pattern exists because most agencies cannot actually show their work. We can, because the numbers below come directly from each client’s own Google Search Console property, the same data any business owner can pull for their own site in under a minute.
This matters more than it might seem. A prospective client evaluating any SEO company in Bangalore has no reliable way to check a testimonial that says “300% traffic growth” with no context. They do have a way to check a claim that says “average position moved from 24 to 7, verified in Search Console, screenshot available on request.” One of those claims can be independently confirmed. The other cannot. We would rather publish the kind of case study that survives scrutiny.
A genuinely honest case study usually has three features a vague one does not. It names the actual client rather than describing them only as “a Bangalore business.” It shows a real date range and specifies whether the figures are a single best month or a sustained average, since those tell very different stories. And it does not hide the parts of the data that complicate the narrative, a plateau, a dip, a single outlier month, because a business owner evaluating an agency deserves to see what normal, real search performance actually looks like over a year, not a single cherry-picked screenshot.
Case Study One: CollegeMarker
CollegeMarker is a college discovery platform helping Karnataka students compare Pre-University colleges by location, fees, and course offerings. OneCity has worked with CollegeMarker since 2019, and the numbers below reflect the most recent twelve months of verified Search Console data, from July 2025 through mid-July 2026, not the full multi-year history, since that is the window we have clean, exportable data for.
Where the Site Stood in July 2025
At the start of this twelve-month window, CollegeMarker was averaging position 24.1 across its tracked queries, roughly 411,500 monthly impressions, and 2,764 monthly clicks. Position 24 sits on page three of Google. Most of that impression volume was effectively invisible traffic: the site was being indexed and occasionally shown, but rarely clicked, because almost nothing on page three gets clicked.
What Changed
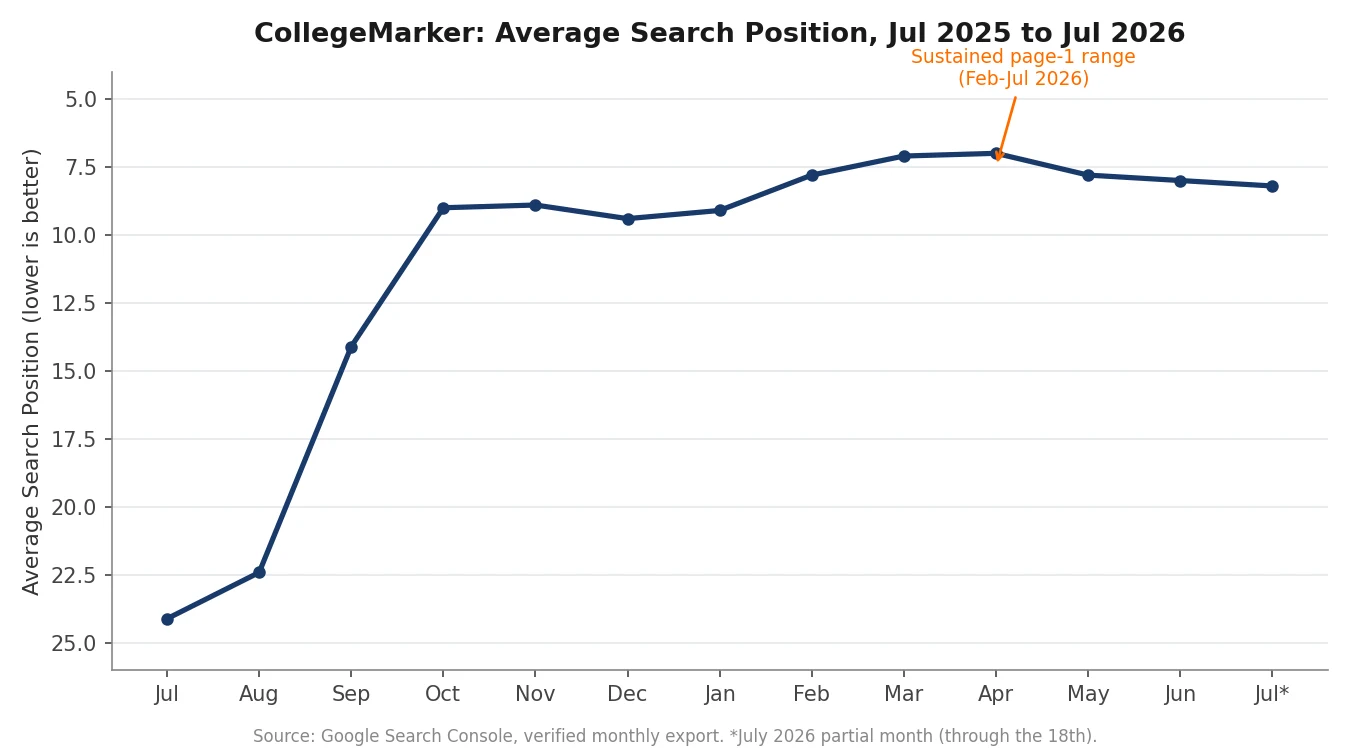
Average position improved steadily through the second half of 2025 and settled into a sustained page-one range from February 2026 onward, six consecutive months between position 7.0 and 8.2 at the time of writing. That consistency matters more than any single best month. A site that spikes to position 3 for one month and drops back to position 20 the next has not built anything durable. A site holding position 7 to 8 for half a year has.
Specific keywords tell the same story with more precision. “Best PU colleges in Bangalore,” a genuinely competitive, high-intent term, now averages position 3.41 with 974 monthly clicks from 28,116 impressions. “Top PU colleges in Bangalore” sits at position 2.91. These are not long-tail terms with no competition. They are the exact phrases a parent or student searching for college options in Bangalore actually types.
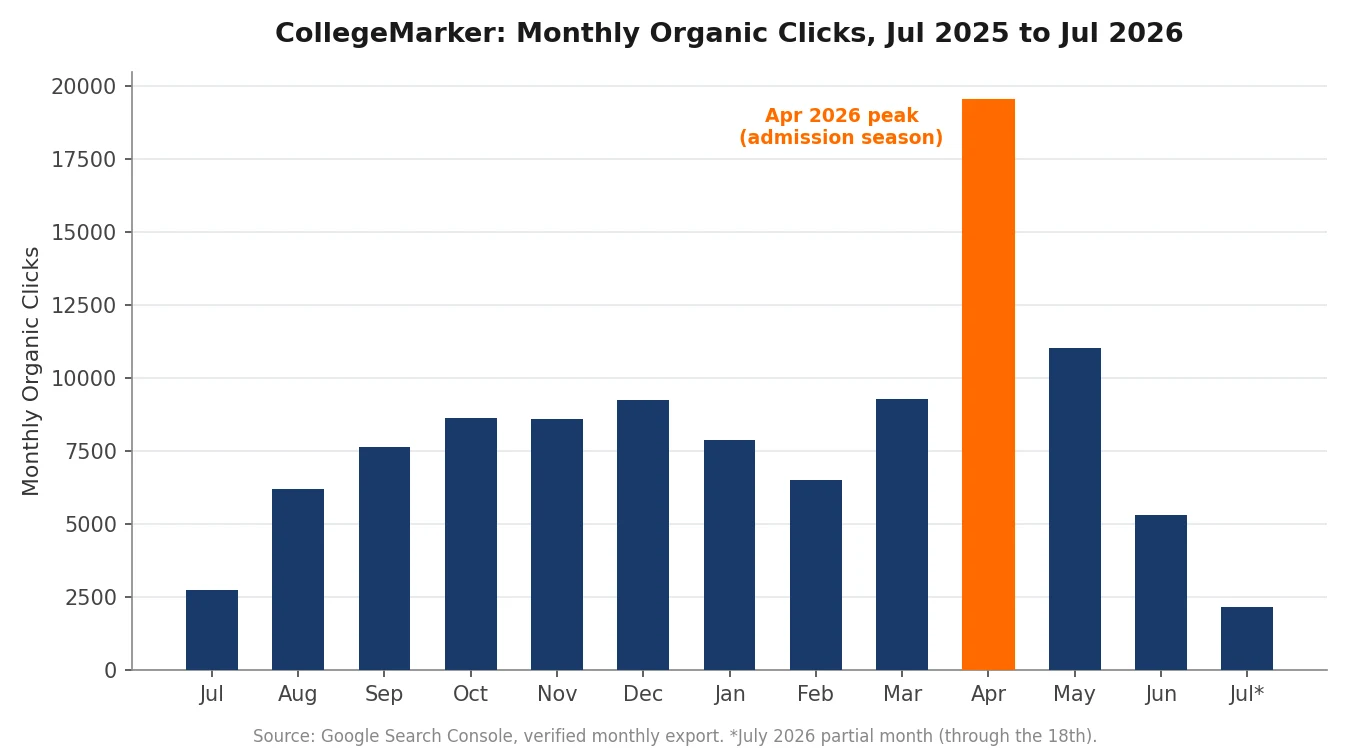
Traffic followed the position gains, though not in a perfectly smooth line, and we are not going to pretend it was. April 2026 was the strongest single month on record: 19,514 clicks from 1,799,726 impressions, a genuine spike that coincided with peak admission-season search volume. The months since have settled back to a steadier 5,300 to 11,000 monthly clicks, still two to four times the July 2025 starting point, and July 2026’s lower figure reflects a partial month of data (through the 18th), not a decline.
The single best-performing page on the site is a blog post, “Best Pre-University Colleges in Bangalore,” which alone accounts for 6,824 clicks and 544,332 impressions over the twelve-month window, averaging position 7.19. One well-built, well-structured piece of content doing that much work is not an accident. It is what happens when a page is built to directly answer the exact question a parent is typing into Google, rather than written around a keyword and hoping the intent matches.
That page is not carrying the account alone, either, which is the more important structural point. CollegeMarker’s traffic comes from a genuine cluster of city-specific pages: Mysore college listings bring in 3,862 clicks from 317,261 impressions at position 6.61, a blog post on free scholarships in Karnataka pulls 3,909 clicks at position 7.52, and dedicated pages for Dharwad, Hassan, and Davangere each contribute four figures worth of monthly impressions in their own right. This is what a content cluster built around real, distinct search intent looks like in practice, city by city, rather than one generic page trying to rank nationally for “PU colleges” and failing to satisfy anyone’s actual, local question.
Case Study Two: WeCare24
WeCare24 provides home nursing, maid services, nanny placement, and security staffing across Bangalore, Mysore, and Mangalore. OneCity has worked with WeCare24 since 2019, and again, the numbers below cover the verified twelve-month window from July 2025 to mid-July 2026.
Where the Site Stood in July 2025
WeCare24 opened this window at an average position of 20.7, with roughly 54,173 monthly impressions and 636 monthly clicks. That is a business with almost no visibility for the local, high-intent searches its customers were actually running: “nanny Bangalore,” “maid services Bangalore,” “home nursing Bangalore,” and similar terms.
What Changed, and What We Are Not Hiding
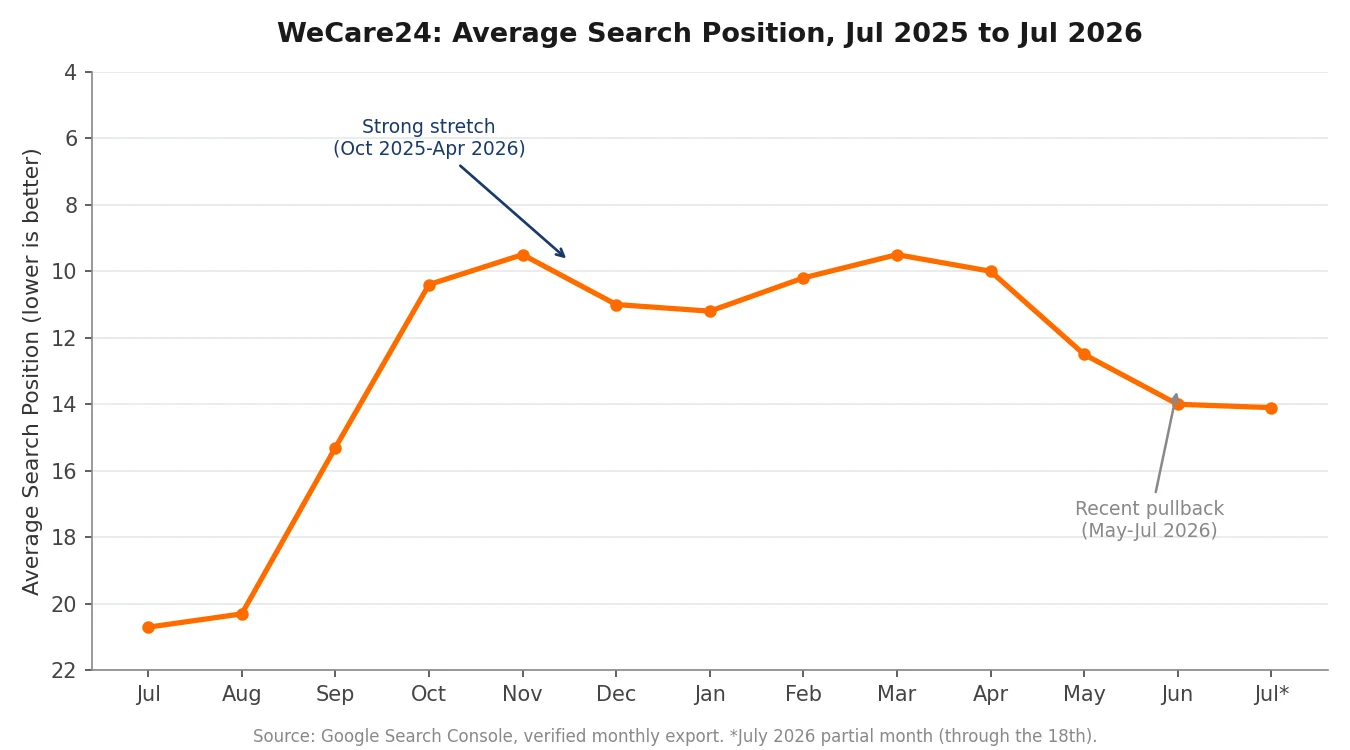
Position improved sharply through late 2025, reaching a strong stretch between 9.5 and 11.2 from October 2025 through April 2026, seven consecutive months of solid page-one visibility. Clicks grew alongside it, peaking at 3,065 in April 2026, close to five times the July 2025 starting figure.
Here is the part a less honest case study would leave out. Over the last three months of the window, May through July 2026, average position drifted back up to a range of 12.5 to 14.1. That is real, it is visible in the same Search Console property, and it is worth explaining rather than hiding. Local service categories like home nursing and domestic staffing see constant competitive churn, new entrants, directory listings, and aggregator sites all fighting for the same local searches. A position gain from a single content push holds for a while and then needs reinforcement. This is precisely the argument for ongoing SEO work over a one-time fix, and it is exactly what the recent months of this account show in practice.
Individual keyword performance remains strong even through that pullback. “WeCare home nursing services” holds position 1.45 with a 7.5 percent click-through rate, well above typical rates for that position, meaning people searching that exact phrase are finding and clicking the listing reliably. “Nanny Bangalore” sits at position 5.4 with 693 clicks from 16,822 impressions.
The top-performing page, “House Maids in Bangalore,” accounts for 5,448 clicks and 287,355 impressions across the window, at an average position of 9.66. It is a local SEO result built around a specific service and a specific city, not a generic homepage trying to rank for everything at once.
The account’s strength is not concentrated in one service line either. “Nanny in Bangalore” brings in 4,135 clicks at position 9.71, an explainer piece on house maid pricing and benefits in Bangalore pulls 2,919 clicks at a strong position 5.43, and a dedicated security-agency page adds 2,936 clicks at position 7.77. WeCare24 runs three genuinely different service lines under one domain, nursing, domestic staffing, and security, and each is showing up in Search Console as its own distinct traffic source rather than one service quietly carrying the other two. That matters for a multi-service business specifically, since it means the SEO work is not accidentally dependent on a single page or a single service category holding its ranking.

What These Two Accounts Have in Common
Both CollegeMarker and WeCare24 moved from page three or worse into sustained page-one visibility on genuinely competitive, commercially relevant terms, not obscure long-tail phrases nobody searches. Both stories include a real fluctuation, an outlier spike for CollegeMarker, a partial pullback for WeCare24, because that is what real search data looks like over twelve months. Neither client’s growth is a straight diagonal line on a chart, and any case study claiming one usually is not showing you the real numbers.
Both accounts also share a structural pattern that goes beyond a single strong page. CollegeMarker’s traffic is spread across a genuine cluster of city-specific college listings, Bangalore, Mysore, Dharwad, Hassan, Davangere, each targeting a distinct local audience rather than one page trying to serve every city at once. WeCare24 shows the same pattern across service lines instead of cities, nursing, domestic staffing, and security, each with its own ranking pages rather than one homepage stretched thin across three unrelated services. Neither account’s visibility depends on a single page holding a single ranking. That distribution is deliberate, and it is a large part of why a temporary dip in one page or one keyword, the kind every account experiences eventually, does not sink the whole account’s traffic with it.
This pattern holds across most successful SEO campaigns we run, and it is worth remembering the next time a proposal promises broad rankings from a handful of thin, generic pages instead of a genuine cluster built around how real customers actually search, city by city or service by service.
A Note on Methodology
Every figure in both case studies above came from a direct twelve-month Search Console Performance export for each client’s own property, covering 19 July 2025 through 18 July 2026. Monthly totals were summed directly from daily data, not sampled or estimated. Average position figures are the mean of daily average positions across each calendar month. Where a month’s figure looked unusually strong or weak against the surrounding trend, specifically CollegeMarker’s April 2026 spike and the partial July 2026 month for both accounts, that context is stated plainly in the relevant section rather than left for a reader to misinterpret on their own.
What the Data Itself Suggests About the Work
We are holding back specific service line items for both accounts until we can confirm the exact scope delivered month by month, since we would rather leave a gap than state a deliverable list we cannot fully verify. What the Search Console data does show plainly is the shape of the approach: neither account grew through one enormous page trying to capture every possible search. Both grew through a deliberate spread of specific, narrowly targeted pages, cities for CollegeMarker, service lines for WeCare24, each written to answer one real question rather than several vague ones.
For a business owner reading this and wondering what it would take to see something similar, the honest answer is patience measured in months rather than weeks, a genuine cluster of pages rather than one flagship page, and content specific enough that a reader immediately recognises their own situation in the first two sentences. None of that is a secret technique. Most of it is simply the discipline to build ten focused pages instead of one broad one, and to keep doing it past the point where the first few months show only modest movement.
Three Questions Worth Asking Your Current SEO Provider
If you already work with an agency and have never seen a case study built this way, three questions are worth putting to them directly, and the answers tend to reveal more than any proposal deck.
Ask for the full twelve-month trend, not the single best month. Anyone can find one strong month in a year of data. A provider who can show sustained position across six or more consecutive months, the way CollegeMarker held position 7 to 8 from February through July 2026, is showing you something considerably harder to manufacture.
Ask whether your account’s traffic depends on one page or a genuine spread of pages. If a single flagship page is doing most of the work, a single algorithm update or a single competitor’s stronger page can undo a large share of your visibility overnight. Both CollegeMarker and WeCare24’s resilience comes partly from spreading that risk across a real cluster rather than concentrating it.
Ask what happened during the worst month in the account’s history, not just the best one. WeCare24’s position drifting from roughly 10 back up to 14 over the last three months of this window is not a failure we are hiding from this piece. It is a normal part of how local search competition actually behaves, and any agency unwilling to discuss a real dip alongside a real gain is not giving you the full picture of what your own account’s data would show if you asked to see it directly.
None of these three questions require specialised knowledge to ask. They require an agency willing to show real, unfiltered data rather than a curated highlight reel, which is the same standard this piece was written to meet.
How to Verify These Numbers Yourself
Every figure in this piece came directly from each client’s Search Console property, exported as a twelve-month Performance report. If you are evaluating OneCity, or any SEO agency in Bangalore, for your own business, ask to see that export live during a consultation rather than accepting a summary slide. Our own checklist for verifying an SEO company’s case studies walks through exactly what to ask for and what red flags to watch for when an agency cannot produce it.
Neither case study above needed a single invented number to be worth reading. A 7x increase in monthly clicks at peak and six straight months holding page one are strong results on their own terms. The industry’s habit of rounding vague testimonials up to impressive-sounding percentages exists mostly because so few agencies have real, checkable numbers to put next to a client’s name. When the real data is this solid, there is no reason to reach for anything else.
Frequently Asked Questions
Are these real clients, or anonymised composites?
Both CollegeMarker and WeCare24 are real, named OneCity clients who agreed to have their Search Console data published. Nothing in either case study is a composite or a hypothetical example.
Why does the data only cover twelve months if these clients have worked with OneCity since 2019?
Search Console’s standard export window is twelve months. We are publishing what we can verify directly rather than reconstructing older figures from memory or estimates, which would not meet our own standard for accurate, source-backed claims.
Why did WeCare24’s position drift back up in the last three months?
Local service categories face constant competitive churn from new entrants and directory listings. A position gain earned through one content and technical push needs ongoing reinforcement to hold, which is the case for supporting an active monthly retainer rather than a one-time project.
Can I see the actual Search Console data behind these numbers?
Yes. We are happy to show the live export for either account, or your own site’s data, during a consultation. Ask directly, since an agency that cannot show its underlying data during a sales conversation is not one whose case studies should be taken at face value.
Does a case study like this apply to my industry if I am not in education or home services?
The underlying pattern, specific direct-answer content outperforming broad generic pages, and sustained position holding more value than a single best month, applies across industries. The exact keywords and competitive dynamics change, the structural lesson does not.
Why does CollegeMarker’s traffic come from multiple city pages instead of one main page?
Students in Mysore search differently than students in Bangalore, even when comparing the same category of college. Building separate, genuinely useful pages for each city captures that distinct local intent, rather than forcing one generic page to rank for searches it was never specifically written to answer.
What happens if one of these accounts’ rankings drops next month?
Some fluctuation is normal and expected, which is exactly why this piece reports the full twelve-month trend rather than a single best month. A distributed cluster of pages, across cities or service lines, means one page or keyword losing position does not collapse the account’s overall visibility, unlike a strategy resting on a single ranking.
Will these case studies be updated as new data comes in?
Yes. The “Updated on” date at the top of this piece will move forward whenever we refresh the underlying numbers with a newer Search Console export, and any material change, positive or negative, will be reflected honestly rather than quietly dropped.
About the Author
L.K. Monu Borkala, Founder & CEO, OneCity Technologies Pvt Ltd
Twenty years in marketing, starting with Yellow Pages print publishing across South India and moving into digital work from 2017. OneCity has built SEO, GEO, and AEO strategy for 650-plus businesses across Bengaluru, Mangaluru, and Mysuru. All strategy and published content is reviewed and approved by Borkala before it goes live.
Connect on LinkedIn | Full profile and credentials | CIN: U72100KA2009PTC048911
L.K. Monu Borkala
Founder & SEO Director, OneCity Technologies
20 years running SEO campaigns from Bangalore. Full author profile · LinkedIn